
“User Experiences of Spanish-Speaking Latinos with the Frontier Behavioral Health Website”
by Raquel L. Dean | Xchanges 14.1, Spring 2019
Results
The data collected was used to address the research question: how do Spanish-speaking Latinos navigate information on the Frontier Behavioral Health website? The results point to a few issues with the user’s experience in navigating the website with ease. These issues are not a reflection of the user’s ability to explore a website but point to a larger issue related to the design, which negatively affected these users’ experiences.
Demographics
Of the total of 13 (n=13) participants, the youngest is 21 years old and the oldest is 31 years old. All participants graduated and received at least a high school education. The participants fell in the following categories: five with “some college,” one with an Associate Degree, five with a bachelor’s Degree, and one with a master’s Degree. Out of all thirteen participants, ten claimed to be on an intermediate level in Spanish, and two on an expert level. Almost all participants rated themselves as extremely familiar with using a computer, tablet, or laptop (mean: 4.86 on a 5-point Likert scale), and all participants spent 5 or more hours a day using some type of technology device.
Results: Time on Task
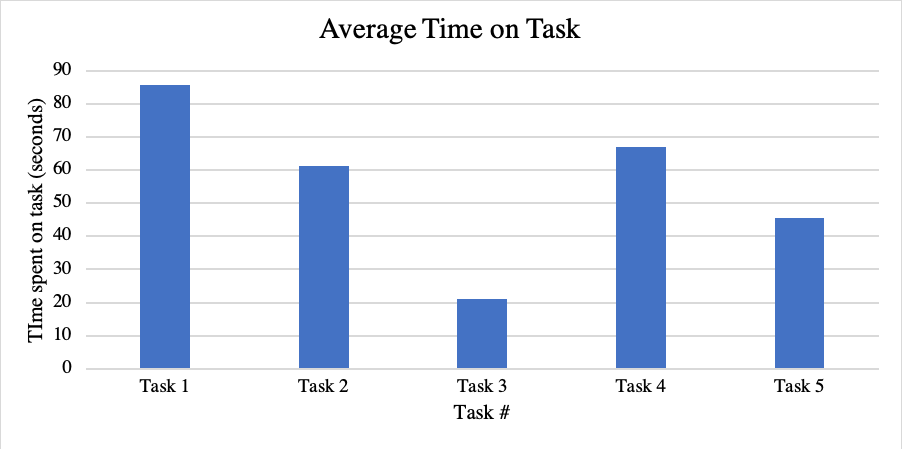
The average (mean) amount of time spent on each task, in seconds: task one (85.66), task two (61.32), task three (21.12 — fastest), task four (288.33 — highest), task five (45.42).
Results: Mouse Clicks
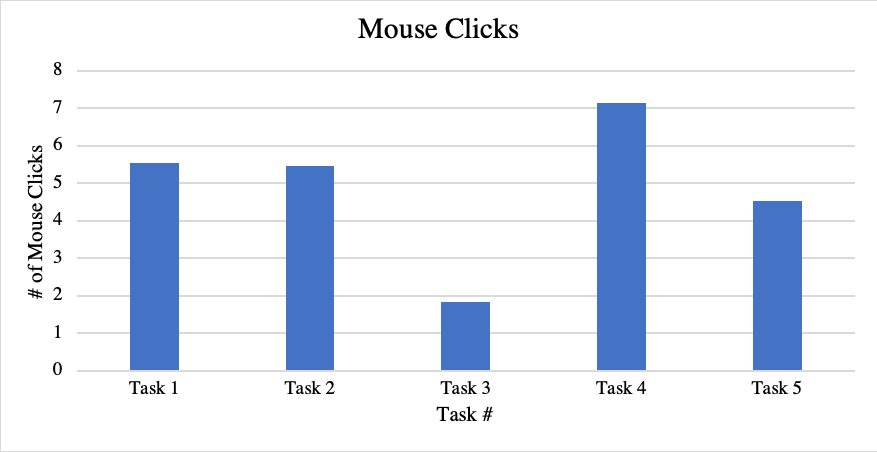
The average (mean) amount of mouse clicks, per task: task one (5.54), task two (5.46), task three (1.85 — lowest), task four (7.15 — highest), task five (4.54). The maximum amount of mouse clicks was 19 for both task one and task four.
Results: Task Success
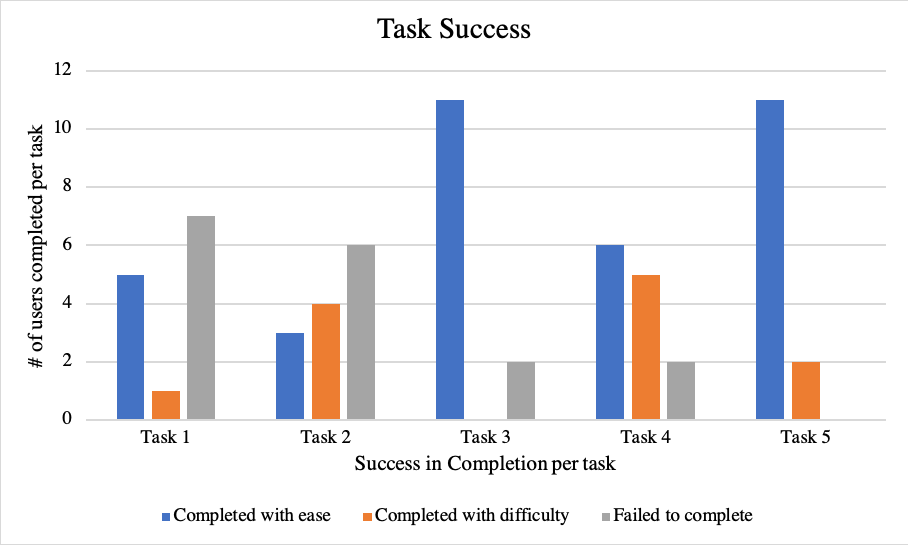
Task success was assessed based on three levels: completed with ease, completed with difficulty, or failed to complete. Task three and task five were the easiest to complete, with 11 of 13 participants completing with ease. Task one had the highest failure rate at 53.85%.
| Completed with ease (%) | Completed with difficulty (%) | Failed to complete (%) | |
|---|---|---|---|
| Task 1 | 38.46 | 7.69 | 53.85 |
| Task 2 | 23.08 | 30.77 | 46.15 |
| Task 3 | 84.62 | 0.00 | 15.38 |
| Task 4 | 46.15 | 38.46 | 15.38 |
| Task 5 | 84.62 | 15.38 | 0.00 |
Table 4: Average User Task Success (%)
Results: Number of Errors Made and Error Level
In total, for the entire study, there were four cosmetic errors, four serious errors, and ten catastrophic errors. Task one was the leading cause of catastrophic level errors, with five of the total ten errors in that category.
| Cosmetic | Serious | Catastrophe | |
|---|---|---|---|
| Task 1 | 1 | — | 5 |
| Task 2 | 3 | 3 | 3 |
| Task 3 | — | — | 1 |
| Task 4 | — | 1 | 1 |
| Task 5 | — | — | — |
| Total | 4 | 4 | 10 |
Table 5: Error Level Per Task